Difference between revisions of "Energy data"
| Line 67: | Line 67: | ||
* {{Citation | vauthors=Uniper | title=Uniper: Gas storage dashboard | url=https://storage-portal.uniper.energy/#/dashboard}} | * {{Citation | vauthors=Uniper | title=Uniper: Gas storage dashboard | url=https://storage-portal.uniper.energy/#/dashboard}} | ||
* {{Citation | vauthors=storengy | title=Gas storage portal | url=https://storageportal.storengy.de/storage-information/storage-info/map}} | * {{Citation | vauthors=storengy | title=Gas storage portal | url=https://storageportal.storengy.de/storage-information/storage-info/map}} | ||
| + | |||
| + | Data not in AGSI summary: | ||
* {{Citation | vauthors=Enercity | title=Gasspeicher Hannover | url=https://www.gasspeicher-hannover.de/speicherbau-und-betrieb/speicherbetrieb/aktuelle-bewegungsdaten.html}} | * {{Citation | vauthors=Enercity | title=Gasspeicher Hannover | url=https://www.gasspeicher-hannover.de/speicherbau-und-betrieb/speicherbetrieb/aktuelle-bewegungsdaten.html}} | ||
* {{Citation | vauthors=TEAG | title=UGS Allmenhausen | url=https://www.thueringerenergie.de/Ueber_uns/Geschaeftsfelder/Speicher/Betriebsdaten}} | * {{Citation | vauthors=TEAG | title=UGS Allmenhausen | url=https://www.thueringerenergie.de/Ueber_uns/Geschaeftsfelder/Speicher/Betriebsdaten}} | ||
Revision as of 19:21, 7 August 2022
Here we list energy open data:
Germany
Trading Hub Europe
THE, Germany: Daily gas consumption
Bundesnetzagentur
BNetzA, Germany: Daily briefings about gas imports, storage, and consumption
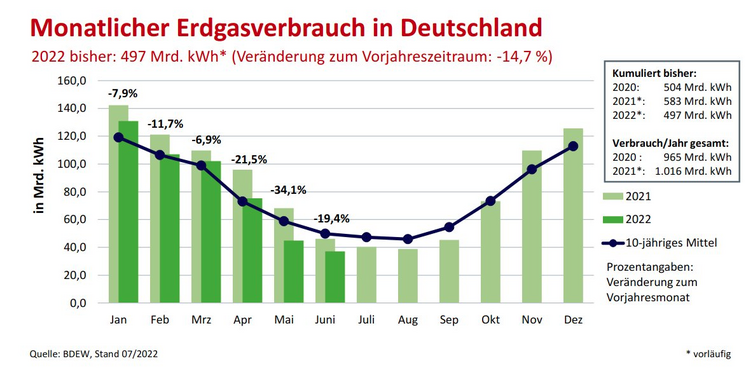
| Month | 2021 | 2022 | Diff. | Diff. |
|---|---|---|---|---|
| TWh | TWh | TWh | % | |
| Jan | 142.3 | 129 | -13.3 | -9.3 % |
| Feb | 121.2 | 106 | -15.2 | -12.5 % |
| Mar | 109.7 | 92.5 | -17.2 | -15.7% |
| Apr | 95.9 | 82.0 | -13.9 | -14.5% |
| May | 68.2 | 51.0 | -17.2 | -25.2% |
| Jun | 46.1 | 33.6 | -12.5 | -27.1% |
| Jul | 40.4 | |||
| Aug | 38.8 | |||
| Sep | 45.3 | |||
| Oct | 73.2 | |||
| Nov | 109.7 | |||
| Dec | 125.6 | |||
| TOTAL | 1016.4 | -89.3 |
BDEW
- BDEW, Germany: Monatlicher Erdgasverbrauch in Deutschland 2022 - Vorjahresvergleich, retrieved 12 July 2022
Eurostat
- Eurostat, EU: Supply, transformation and consumption of gas, retrieved 30 March 2022
- Eurostat, EU: Imports of natural gas by partner country - monthly data, retrieved 4 April 2022
- Eurostat, GERMANY: Imports of natural gas by partner country - monthly data, retrieved 4 July 2022
- Eurostat, GERMANY: Exports of natural gas by partner country - monthly data, retrieved 4 July 2022
EU
Gas storage inventory
- AGSI, EU: Gas in storage (current + historical data)
- Uniper, Uniper: Gas storage dashboard
- storengy, Gas storage portal
Data not in AGSI summary:
- Enercity, Gasspeicher Hannover
- TEAG, UGS Allmenhausen
- Enovos, Gasspeicher Frankenthal
Bruegel
- Bruegel, EU: Natural gas imports (plots), retrieved 12 July 2022
ENTSOG gas data
- ENTSOG API manual ENTSOG (2018), ENTSOG Transparency Platform API User Manual (PDF)
- ENTSOG. “ENTSOG - TP User Manual_v_4.5.Pdf,” 2021. https://www.entsog.eu/sites/default/files/2021-07/ENTSOG%20-%20TP%20User%20Manual_v_4.5.pdf.
ENTSOG example query to get physical flows on 01 March 2022:
Some analyses (experimental, feedback welcome):
ENTSOG data as relational database
(Experimental, physical flow data from 01 Jan 2021 to 05 Aug 2022, where flow value is not null)
Postgres access: psql -h embargo.energy -U embargo entsog ; password: 9mTc_9hPjk}&D27/F,VHC8qG
Some tentative examples:
Give out consumption (apparently underestimation)
select left(operatorkey,2), date_trunc('month', periodto), round(sum(value)) from flows where pointkey in (select pointKey from operator where pointtype = 'Aggregated Point - Final Consumers') and flowstatus = 'Confirmed' group by left(operatorkey,2), date_trunc('month', periodto) order by left(operatorkey,2), date_trunc('month', periodto);
Sort by distribution points
select pointlabel, operatorlabel, sum(value) from flows where pointkey in (select pointKey from operator where pointtype = 'Aggregated Point - Final Consumers') and periodto > '2022-07-01' and periodto <= '2022-08-01' and left(operatorkey,2) = 'DE' group by operatorlabel, pointlabel order by operatorlabel ;
Python scripts: git clone https://git.embargo.energy/entsog.git
EU: Energy prices
- European Commission, EU: Energy price dashboard - historical data, retrieved 23 July 2022
