Difference between revisions of "Critical analysis: vbw-study "Folgen einer Lieferunterbrechung von russischem Gas für die deutsche Industrie" (June 2022)"
Jump to navigation
Jump to search
| Line 1: | Line 1: | ||
[[File:Vbw-study-table5.png|thumb|alt=]] | [[File:Vbw-study-table5.png|thumb|alt=]] | ||
| − | + | [[File:Corrected table 5.png|thumb]] | |
Media coverage of this study: | Media coverage of this study: | ||
| − | * {{Citation | title=Deutschlands Wettbewerbsstärke: Forscher warnen vor Gaskrise – Speicher jetzt zu 60 Prozent gefüllt | url=https://www.faz.net/aktuell/wirtschaft/gaslieferungen-abhaengigkeit-gefaehrdet-deutschlands-wettbewerbsfaehigkeit-18133876.html | access-date=28 June 2022}} | + | *{{Citation | title=Deutschlands Wettbewerbsstärke: Forscher warnen vor Gaskrise – Speicher jetzt zu 60 Prozent gefüllt | url=https://www.faz.net/aktuell/wirtschaft/gaslieferungen-abhaengigkeit-gefaehrdet-deutschlands-wettbewerbsfaehigkeit-18133876.html | access-date=28 June 2022}} |
| − | * https://www.spiegel.de/wirtschaft/unternehmen/russlands-gas-lieferstopp-verband-warnt-vor-wirtschaftseinbruch-um-12-7-prozent-a-cf67b579-8951-4706-9272-e60d71c03a23 | + | *https://www.spiegel.de/wirtschaft/unternehmen/russlands-gas-lieferstopp-verband-warnt-vor-wirtschaftseinbruch-um-12-7-prozent-a-cf67b579-8951-4706-9272-e60d71c03a23 |
| − | * https://www.manager-magazin.de/politik/deutschland/gas-stopp-russischer-gaslieferungen-koennte-deutschland-rund-13-prozent-der-wirtschaftsleistung-kosten-a-0ae39890-5c4d-425a-abca-a567f1bd936b | + | *https://www.manager-magazin.de/politik/deutschland/gas-stopp-russischer-gaslieferungen-koennte-deutschland-rund-13-prozent-der-wirtschaftsleistung-kosten-a-0ae39890-5c4d-425a-abca-a567f1bd936b |
Our analysis of VBW study <ref> {{Citation | vauthors=vbw | year=2022 | title=Konsequenzen eines Importstopps von russischem Erdgas | url=https://www.vbw-bayern.de/vbw/Themen-und-Services/Energie-Klima/Energie/Folgen-einer-Lieferunterbrechung-von-russischem-Gas-f%C3%BCr-die-deutsche-Industrie.jsp | access-date=28 June 2022}}</ref>: | Our analysis of VBW study <ref> {{Citation | vauthors=vbw | year=2022 | title=Konsequenzen eines Importstopps von russischem Erdgas | url=https://www.vbw-bayern.de/vbw/Themen-und-Services/Energie-Klima/Energie/Folgen-einer-Lieferunterbrechung-von-russischem-Gas-f%C3%BCr-die-deutsche-Industrie.jsp | access-date=28 June 2022}}</ref>: | ||
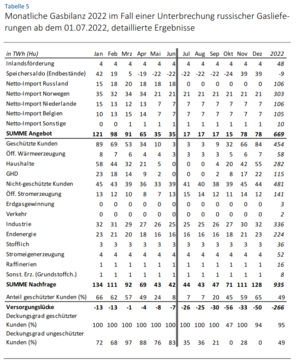
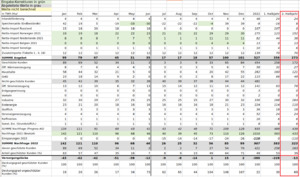
| − | * Our main critique is that the gas gap is calculated as too big, as in Table 5 (page 44 of the study), depicted also in the image. This Table 5 is used for the core results of the study (e.g. Abbildung on page 24). There is an underestimation of imports from the Netherlands, Norway, which suddenly decrease in May/June as opposed to April, contradicting in Table 1 and Abbildung 1. "Diese gelieferten Gasmengen werden auf die zusätzlich Gesamtmengen' werden auf die gelieferten Vorjahresmengen addiert." (p. 17). If we simply take the same value progression and add the 111 TWh from additional sources from Table 1, then the gas gap ("Versorgungslücke") disappears entirely. | + | *Our main critique is that the gas gap is calculated as too big, as in Table 5 (page 44 of the study), depicted also in the image. This Table 5 is used for the core results of the study (e.g. Abbildung on page 24). There is an underestimation of imports from the Netherlands, Norway, which suddenly decrease in May/June as opposed to April, contradicting in Table 1 and Abbildung 1. "Diese gelieferten Gasmengen werden auf die zusätzlich Gesamtmengen' werden auf die gelieferten Vorjahresmengen addiert." (p. 17). If we simply take the same value progression and add the 111 TWh from additional sources from Table 1, then the gas gap ("Versorgungslücke") disappears entirely (as shown in the table with green underlinings). |
| − | * Additional critiques. | + | *Additional critiques. |
<references /> | <references /> | ||
Revision as of 07:41, 29 June 2022
Media coverage of this study:
- Deutschlands Wettbewerbsstärke: Forscher warnen vor Gaskrise – Speicher jetzt zu 60 Prozent gefüllt, retrieved 28 June 2022
- https://www.spiegel.de/wirtschaft/unternehmen/russlands-gas-lieferstopp-verband-warnt-vor-wirtschaftseinbruch-um-12-7-prozent-a-cf67b579-8951-4706-9272-e60d71c03a23
- https://www.manager-magazin.de/politik/deutschland/gas-stopp-russischer-gaslieferungen-koennte-deutschland-rund-13-prozent-der-wirtschaftsleistung-kosten-a-0ae39890-5c4d-425a-abca-a567f1bd936b
Our analysis of VBW study [1]:
- Our main critique is that the gas gap is calculated as too big, as in Table 5 (page 44 of the study), depicted also in the image. This Table 5 is used for the core results of the study (e.g. Abbildung on page 24). There is an underestimation of imports from the Netherlands, Norway, which suddenly decrease in May/June as opposed to April, contradicting in Table 1 and Abbildung 1. "Diese gelieferten Gasmengen werden auf die zusätzlich Gesamtmengen' werden auf die gelieferten Vorjahresmengen addiert." (p. 17). If we simply take the same value progression and add the 111 TWh from additional sources from Table 1, then the gas gap ("Versorgungslücke") disappears entirely (as shown in the table with green underlinings).
- Additional critiques.
- ↑ vbw (2022), Konsequenzen eines Importstopps von russischem Erdgas, retrieved 28 June 2022

