Difference between revisions of "Critical analysis: vbw-study "Folgen einer Lieferunterbrechung von russischem Gas für die deutsche Industrie" (June 2022)"
Jump to navigation
Jump to search
| Line 12: | Line 12: | ||
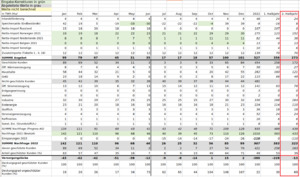
** There is an underestimation of imports from the Netherlands, Norway, which suddenly decrease in May/June as opposed to April, contradicting in Table 1 and Abbildung 1. "Diese gelieferten Gasmengen werden auf die gelieferten Vorjahresmengen addiert." (p. 17). If we simply take the same value progression and add the 111 TWh from additional sources from Table 1, then the gas gap ("Versorgungslücke") disappears entirely (as shown in the table with green underlinings shown here). | ** There is an underestimation of imports from the Netherlands, Norway, which suddenly decrease in May/June as opposed to April, contradicting in Table 1 and Abbildung 1. "Diese gelieferten Gasmengen werden auf die gelieferten Vorjahresmengen addiert." (p. 17). If we simply take the same value progression and add the 111 TWh from additional sources from Table 1, then the gas gap ("Versorgungslücke") disappears entirely (as shown in the table with green underlinings shown here). | ||
** Also Table 5 apparently does *not* take into account savings calculated in Table 2. For instance it does not take into account gas savings of around 10-15% in 2022 versus 2021, which already have been realized and can be seen in https://www.bundesnetzagentur.de/DE/Fachthemen/ElektrizitaetundGas/Versorgungssicherheit/aktuelle_gasversorgung/start.html | ** Also Table 5 apparently does *not* take into account savings calculated in Table 2. For instance it does not take into account gas savings of around 10-15% in 2022 versus 2021, which already have been realized and can be seen in https://www.bundesnetzagentur.de/DE/Fachthemen/ElektrizitaetundGas/Versorgungssicherheit/aktuelle_gasversorgung/start.html | ||
| + | ** The estimated storage filling amounts in July-Oct in Table 5 are too high (90 TWh), which explicitly contradicts the statement on p. 7: "Zum Erreichen der deutschlandweiten Füllstandsvorgabe von 90 Prozent bis zum 01. November 2022 werden noch rund 78 TWh (Hu) (Bayern: 12 TWh) benötigt (ohne Haidach)." Furthermore, the storage filling level reached 60% as of June 28, so the actual amount needed after July 1st will be even lower (~70 TWh). | ||
| − | *Other findings | + | * Other findings |
** Table 2 (page 20) impact of temperature reduction gives a very un-ambitious figure for household energy savings allocated to UBA without further explanation. | ** Table 2 (page 20) impact of temperature reduction gives a very un-ambitious figure for household energy savings allocated to UBA without further explanation. | ||
| − | + | = References = | |
<references /> | <references /> | ||
Revision as of 09:21, 29 June 2022
Media coverage of this study:
- Deutschlands Wettbewerbsstärke: Forscher warnen vor Gaskrise – Speicher jetzt zu 60 Prozent gefüllt, retrieved 28 June 2022
- https://www.spiegel.de/wirtschaft/unternehmen/russlands-gas-lieferstopp-verband-warnt-vor-wirtschaftseinbruch-um-12-7-prozent-a-cf67b579-8951-4706-9272-e60d71c03a23
- https://www.manager-magazin.de/politik/deutschland/gas-stopp-russischer-gaslieferungen-koennte-deutschland-rund-13-prozent-der-wirtschaftsleistung-kosten-a-0ae39890-5c4d-425a-abca-a567f1bd936b
Our initial analysis of VBW study [1]:
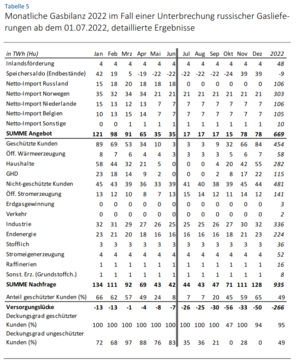
- Our main critique is that the gas gap is calculated as too big, as in Table 5 (page 44 of the study), depicted also in the image. This Table 5 is used for the core results of the study (e.g. Abbildung on page 24).
- There is an underestimation of imports from the Netherlands, Norway, which suddenly decrease in May/June as opposed to April, contradicting in Table 1 and Abbildung 1. "Diese gelieferten Gasmengen werden auf die gelieferten Vorjahresmengen addiert." (p. 17). If we simply take the same value progression and add the 111 TWh from additional sources from Table 1, then the gas gap ("Versorgungslücke") disappears entirely (as shown in the table with green underlinings shown here).
- Also Table 5 apparently does *not* take into account savings calculated in Table 2. For instance it does not take into account gas savings of around 10-15% in 2022 versus 2021, which already have been realized and can be seen in https://www.bundesnetzagentur.de/DE/Fachthemen/ElektrizitaetundGas/Versorgungssicherheit/aktuelle_gasversorgung/start.html
- The estimated storage filling amounts in July-Oct in Table 5 are too high (90 TWh), which explicitly contradicts the statement on p. 7: "Zum Erreichen der deutschlandweiten Füllstandsvorgabe von 90 Prozent bis zum 01. November 2022 werden noch rund 78 TWh (Hu) (Bayern: 12 TWh) benötigt (ohne Haidach)." Furthermore, the storage filling level reached 60% as of June 28, so the actual amount needed after July 1st will be even lower (~70 TWh).
- Other findings
- Table 2 (page 20) impact of temperature reduction gives a very un-ambitious figure for household energy savings allocated to UBA without further explanation.
References
- ↑ vbw (2022), Konsequenzen eines Importstopps von russischem Erdgas, retrieved 28 June 2022

