Critical analysis: vbw-study "Folgen einer Lieferunterbrechung von russischem Gas für die deutsche Industrie" (June 2022)
Background
This study was carried out by Prognos AG and paid by vbw - Vereinigung der Bayerischen Wirtschaft e. V.[1].
The main findings (12,7 % economic output reduction and 5.6 million "affected" jobs) are used as an argument that Russian gas supply stop would have "catastrophic" consequences for the German economy. However, those number were obtained based on unrealistic and/or outdated assumptions, which we will try to explain in the following. Furthermore, both numbers are prone to misinterpretation, which was already the case in the IWH study.
These results are interesting in that they contradict other analyses. For example, the latest joint diagnosis by five leading economic institutes, which also models supply freezes from July, concludes that there will be no gas shortage in 2022. This is true even for the worst-case scenario with the most pessimistic assumptions.[2] The authors explain this discrepancy by saying that "in this study, natural gas-intensive production processes are considered separately and in great detail" (p. 31). However, we show that larger gas gaps and correspondingly higher economic effects result primarily from a massive and implausible underestimation of replacement imports in the 2nd half of 2022,
Our critical analysis
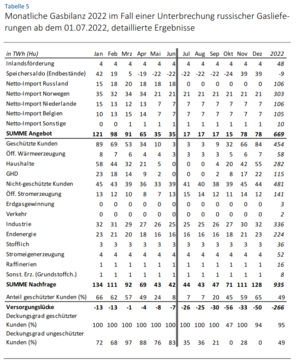
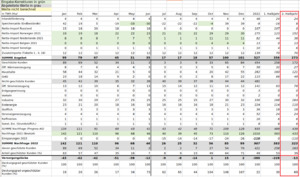
Our main criticism is that the gas gap of 154 TWh (full year 2022) and 108 TWh (2nd half year) is largely overestimated. This happens due to wrong or implausible assumptions, as can be seen in Table 5 (page 44 of the study, see figure on the right). This Table 5 is used for the core results of the study (e.g. figure on page 24). In detail:
- Supply (Jul-Dec: 70 to 170 TWh missing)
- The estimated storage filling amounts for July-Oct in Table 5 are too high (90 TWh), which explicitly contradicts the statement on p. 7: "To reach the Germany-wide fill level target of 90% by Nov 01, 2022, about 78 TWh (Hu) (Bavaria: 12 TWh) will still be needed (excluding Haidach)." Moreover, the storage level reached 61% (148 TWh) as of June 30, so the actual demand after July 1 will be even lower (~70 TWh).
- There is an underestimation of imports from the Netherlands and Norway in the 2nd half of the year, which suddenly decrease in May/June in contrast to April, which contradicts the premises of the study (p.17, table 1, figure 1) as well as actual imports. If the calculation method on p.17 is applied - i.e. the additional gas volumes of just under 140 TWh are distributed evenly over the months and added to the corresponding volumes supplied in the previous year - this results in just under 50 TWh more gas supply in the 2nd half of the year than is shown in Table 5.
- However, non-Russian imports increased by 100 TWh in Q1 2022 alone compared to Q1 2021 (Fig. 1), and remain at the high level. This suggests that the additional supply of 140 TWh per year was too pessimistically estimated. For example, Norway delivered +80% more in Q1 instead of +10% (Fig. 1). If we assume that deliveries remain at similar levels in H2 as before, this results in a supply plus of 150 TWh compared to Table 5.
- There is an underestimation of imports from the Netherlands, Norway, which suddenly decrease in May/June as opposed to April, contradicting in Table 1 and Abbildung 1. "Diese gelieferten Gasmengen werden auf die gelieferten Vorjahresmengen addiert." (p. 17). If we simply take the same value progression and add the 111 TWh from additional sources from Table 1, then the gas gap ("Versorgungslücke") disappears entirely (as shown in the table with green underlinings shown here).
- Also Table 5 apparently does *not* take into account savings calculated in Table 2. For instance it does not take into account gas savings of around 10-15% in 2022 versus 2021, which already have been realized and can be seen in https://www.bundesnetzagentur.de/DE/Fachthemen/ElektrizitaetundGas/Versorgungssicherheit/aktuelle_gasversorgung/start.html
- The estimated storage filling amounts in July-Oct in Table 5 are too high (90 TWh), which explicitly contradicts the statement on p. 7: "Zum Erreichen der deutschlandweiten Füllstandsvorgabe von 90 Prozent bis zum 01. November 2022 werden noch rund 78 TWh (Hu) (Bayern: 12 TWh) benötigt (ohne Haidach)." Furthermore, the storage filling level reached 61% (148 TWh) as of June 30, so the actual amount needed after July 1st will be even lower (~70 TWh).
- Demand (Jul-Dec: overestimated by at least 6 TWh )
- Other findings
- Table 2 (page 20) impact of temperature reduction gives a very un-ambitious figure for household energy savings allocated to UBA without further explanation.
Importantly, the results of vbw/Prognos study are in disagreement with other available evidence. For instance, the recent "Gemeinschaftsdiagnose" study, a joint effort of five leading economic institutes, comes to the conclusion that there will be no gas shortage in 2022 if Russian supply stops in July. This even holds in the worst case scenario with most pessimistic assumptions [3].
Media coverage of this study
- Deutschlands Wettbewerbsstärke: Forscher warnen vor Gaskrise – Speicher jetzt zu 60 Prozent gefüllt, retrieved 28 June 2022
- https://www.spiegel.de/wirtschaft/unternehmen/russlands-gas-lieferstopp-verband-warnt-vor-wirtschaftseinbruch-um-12-7-prozent-a-cf67b579-8951-4706-9272-e60d71c03a23
- https://www.manager-magazin.de/politik/deutschland/gas-stopp-russischer-gaslieferungen-koennte-deutschland-rund-13-prozent-der-wirtschaftsleistung-kosten-a-0ae39890-5c4d-425a-abca-a567f1bd936b
- https://www.br.de/nachrichten/wirtschaft/gas-stopp-aus-russland-wuerde-laut-studie-wirtschaft-hart-treffen,TA3Wggm
References
- ↑ vbw (2022), Konsequenzen eines Importstopps von russischem Erdgas, retrieved 28 Juni 2022
{{citation}}: Check date values in:|access-date=(help) - ↑ Gemeinschaftsdiagnose (2022), Zur Gefahr einer Gaslücke in Deutschland bei einem Wegfall russischer Lieferungen - Sonderauswertung Juni 2022 (PDF)
- ↑ Gemeinschaftsdiagnose (2022), Zur Gefahr einer Gaslücke in Deutschland bei einem Wegfall russischer Lieferungen – Sonderauswertung Juni 2022 (PDF)

